Main conclusion
A repair budget needs both the job and the local labor rate
The same hours of work can produce a different planning total without any change to the broken part. In this model, location changes the labor bill by $524.32. That makes a national or model-level repair range a starting point for local budgeting, rather than a substitute for the shop's estimate.
Evidence scope: 50 metros · fixed eight-hour scenario · no parts or tax. Source snapshot: Labor model reviewed 2026-09-04. The interpretation below uses these retained inputs.
A common axis makes the metro assumptions comparable. Every metro has equal weight; this is not a national shop survey.
AutoWarranty labor model; inputs reviewed September 4, 2026. Not surveyed shop prices.
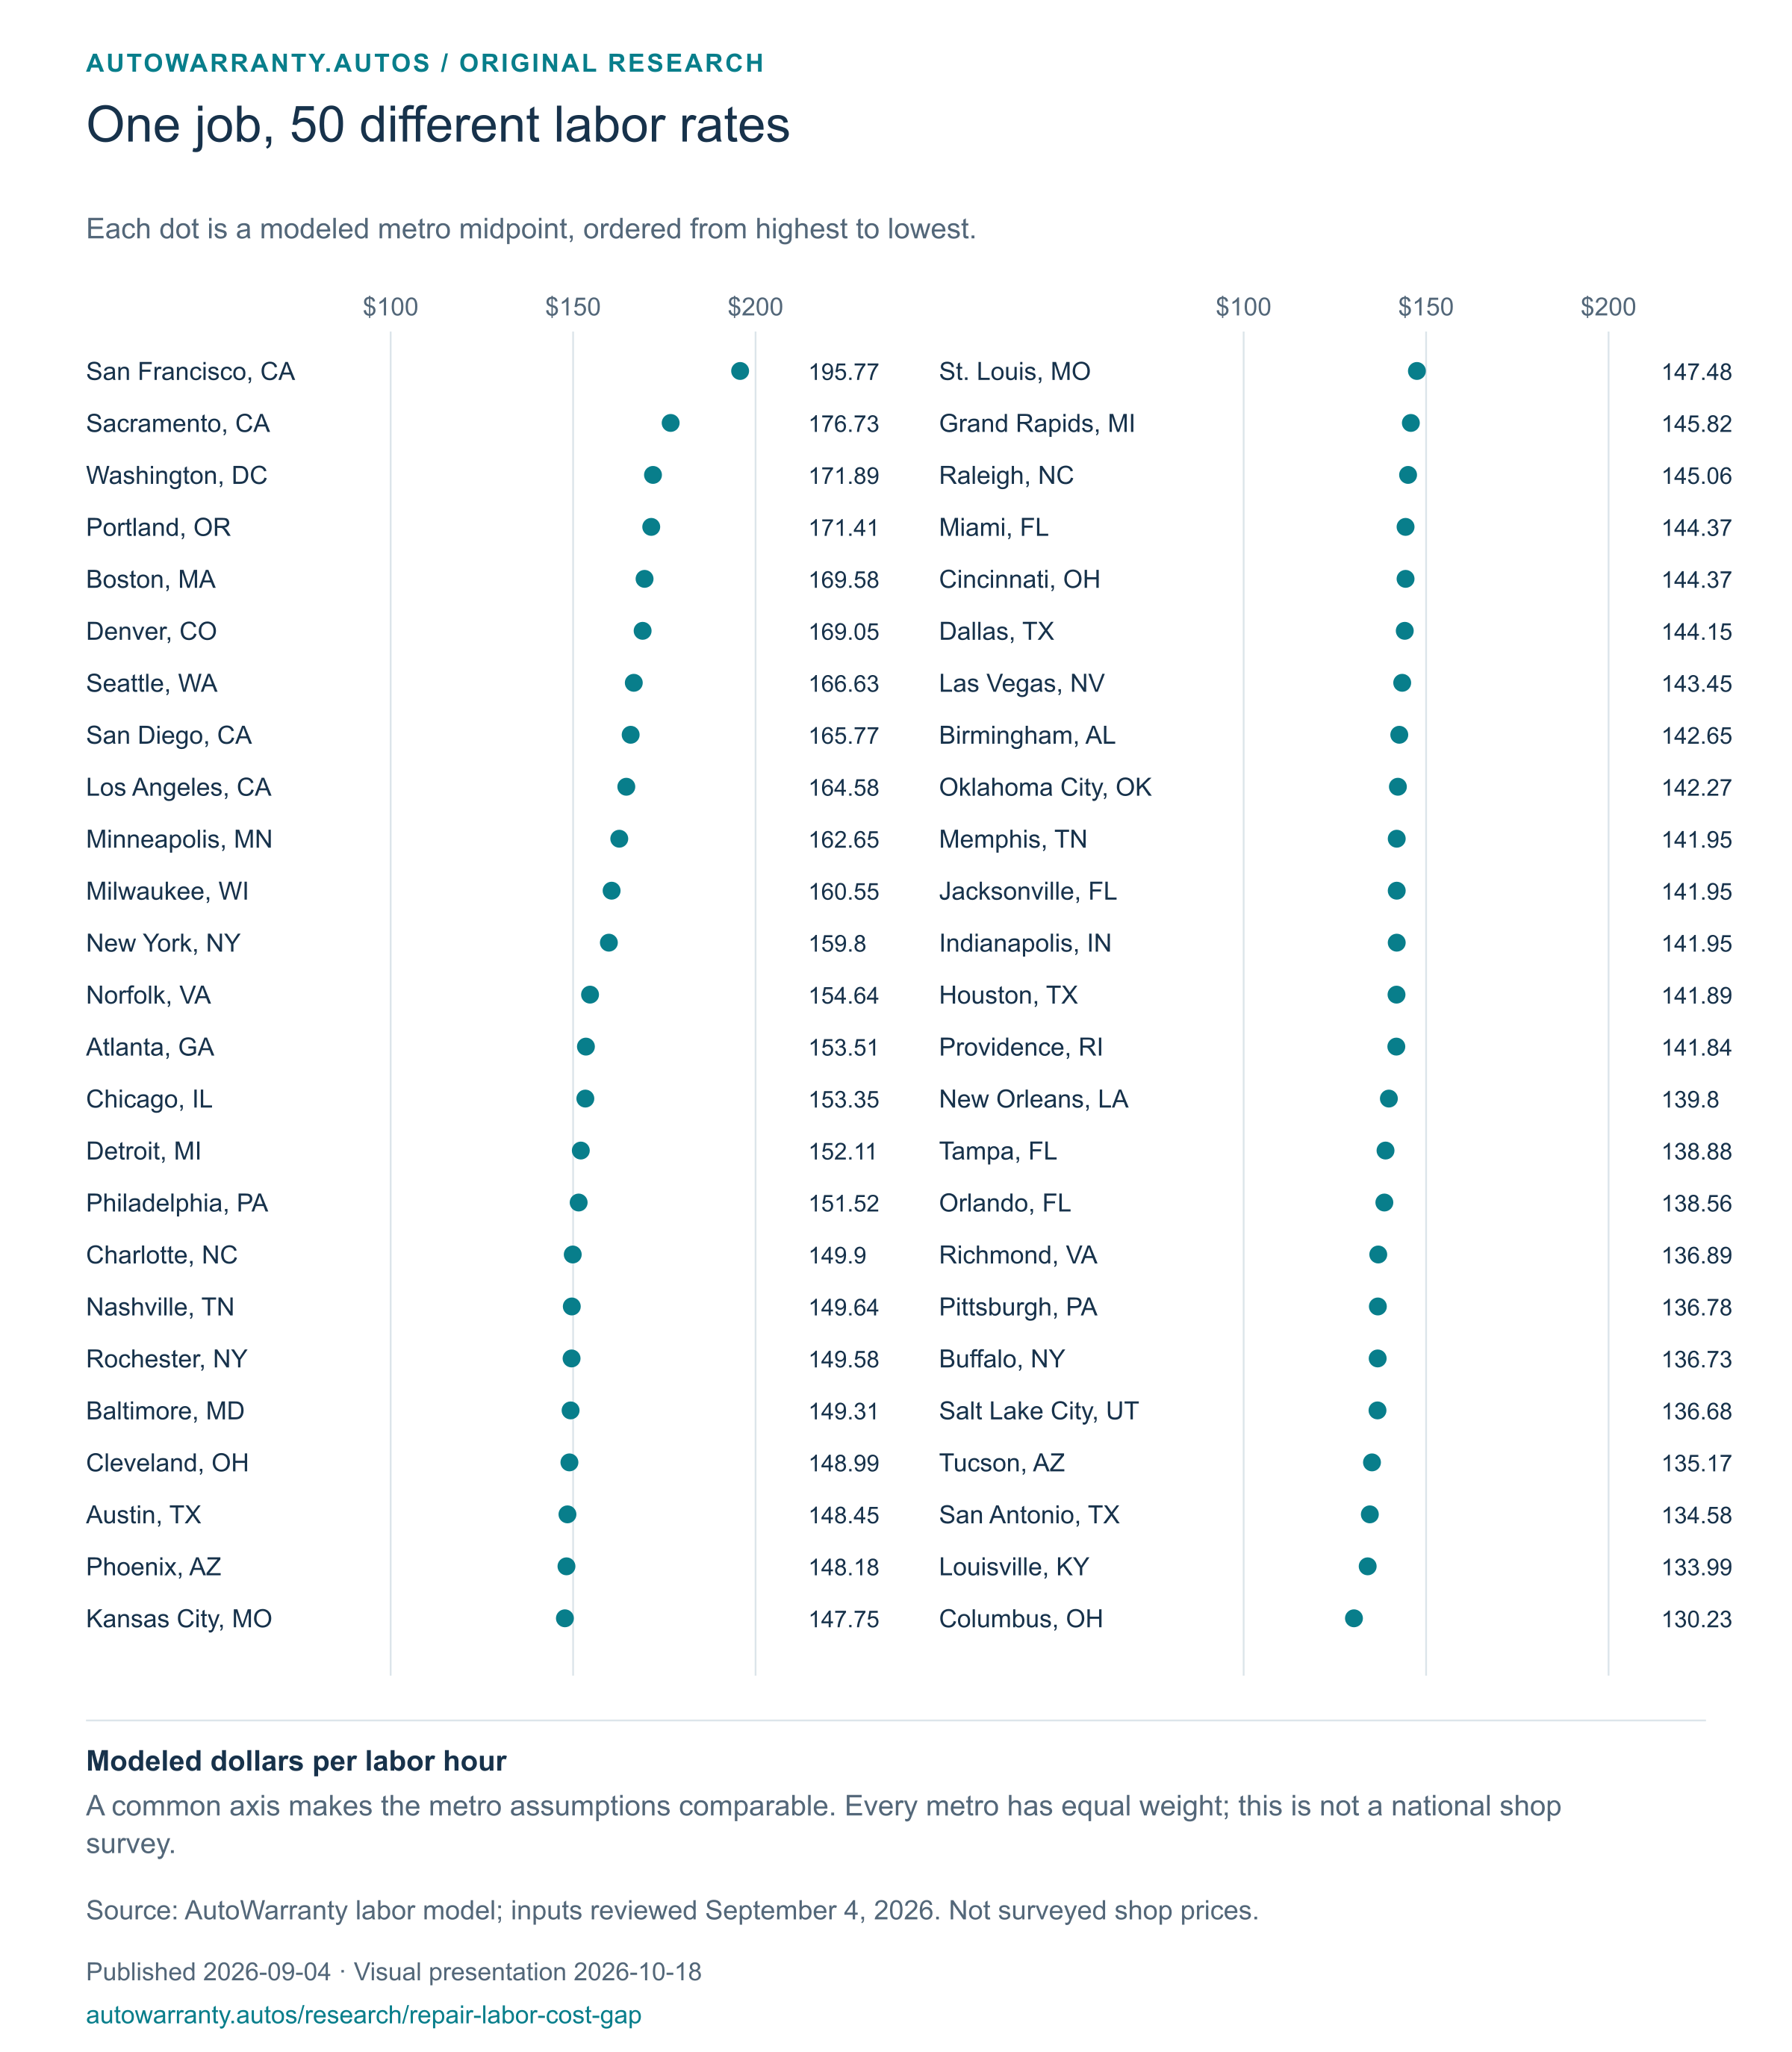
Read the chart as a table
| Record or scenario | Modeled dollars per labor hour |
|---|---|
| San Francisco, CA | 195.77 |
| Sacramento, CA | 176.73 |
| Washington, DC | 171.89 |
| Portland, OR | 171.41 |
| Boston, MA | 169.58 |
| Denver, CO | 169.05 |
| Seattle, WA | 166.63 |
| San Diego, CA | 165.77 |
| Los Angeles, CA | 164.58 |
| Minneapolis, MN | 162.65 |
| Milwaukee, WI | 160.55 |
| New York, NY | 159.8 |
| Norfolk, VA | 154.64 |
| Atlanta, GA | 153.51 |
| Chicago, IL | 153.35 |
| Detroit, MI | 152.11 |
| Philadelphia, PA | 151.52 |
| Charlotte, NC | 149.9 |
| Nashville, TN | 149.64 |
| Rochester, NY | 149.58 |
| Baltimore, MD | 149.31 |
| Cleveland, OH | 148.99 |
| Austin, TX | 148.45 |
| Phoenix, AZ | 148.18 |
| Kansas City, MO | 147.75 |
| St. Louis, MO | 147.48 |
| Grand Rapids, MI | 145.82 |
| Raleigh, NC | 145.06 |
| Miami, FL | 144.37 |
| Cincinnati, OH | 144.37 |
| Dallas, TX | 144.15 |
| Las Vegas, NV | 143.45 |
| Birmingham, AL | 142.65 |
| Oklahoma City, OK | 142.27 |
| Memphis, TN | 141.95 |
| Jacksonville, FL | 141.95 |
| Indianapolis, IN | 141.95 |
| Houston, TX | 141.89 |
| Providence, RI | 141.84 |
| New Orleans, LA | 139.8 |
| Tampa, FL | 138.88 |
| Orlando, FL | 138.56 |
| Richmond, VA | 136.89 |
| Pittsburgh, PA | 136.78 |
| Buffalo, NY | 136.73 |
| Salt Lake City, UT | 136.68 |
| Tucson, AZ | 135.17 |
| San Antonio, TX | 134.58 |
| Louisville, KY | 133.99 |
| Columbus, OH | 130.23 |
Embed this chart with its source note
The embed includes the chart, its source dates and a link to the method. It contains no tracking scripts.
<iframe src="https://autowarranty.autos/research/repair-labor-cost-gap/embed" title="AutoWarranty research chart" width="100%" height="900" loading="lazy" style="border:0" referrerpolicy="no-referrer"></iframe>Analysis
What holding the job constant lets us explain
The comparison separates two reasons a repair bill can change. One is the work itself: the component, parts and hours. The other is what the shop charges for those hours. By fixing the work at eight hours and leaving parts outside the calculation, this experiment attributes the entire $524.32 spread to the model's hourly-rate assumptions.
That separation changes how to use a repair range. If the same job is priced in two locations, a higher total does not necessarily describe a more complex failure or more work. Conversely, a low benchmark from another location may understate the labor budget at the intended shop. The difference grows with the hours because the rate applies to every hour in the job.
The inference is about sensitivity to a rate, not observed market prices. Each of the 50 metros has equal weight, and the rates are planning assumptions rather than a shop survey. The evidence supports asking for a local hourly rate and a job-specific hour estimate. It does not establish a national average repair bill or a likelihood of needing the repair.
Finding 01
The same repair can leave you with a different bill
An eight-hour repair would cost $1,041.84 in labor at our modeled rate for Columbus, compared with $1,566.16 in San Francisco. That's 50.3% more for the same hours of work, before parts. The hourly rates behind that comparison are $130.23 and $195.77.
These are modeled prices, not bills collected from repair shops. We used eight hours so you can see the effect of location on one fixed job. Eight hours isn't an average repair time, and this example doesn't refer to a particular broken part.
That difference matters when you're shopping for coverage. If a plan's labor allowance is below your shop's rate, you could owe the gap even on an approved repair. Check limits on labor hours, parts and the total claim payment too.
The $524.32 difference isolates location assumptions for the same eight-hour job. Eight hours is not an observed average repair time.
AutoWarranty labor model; inputs reviewed September 4, 2026. Not surveyed shop prices.

Read the chart as a table
| Record or scenario | Modeled labor-only dollars |
|---|---|
| Columbus, OH | 1,041.84 |
| 50-metro median reference | 1,180.92 |
| San Francisco, CA | 1,566.16 |
Finding 02
Use a local quote when you can get one
The middle of our 50-city range is $147.62 per hour, or $1,180.92 for eight hours using the unrounded rate. Each city has equal weight in that calculation. It isn't a national average based on population, vehicle numbers or shop visits.
For your own decision, a written estimate from your usual shop is more useful than the rate for the nearest big city. Specialists, equipment and the work involved can change the price even between shops a few miles apart.
We haven't compared dealer and independent-shop prices here. Our dealer rates use a fixed markup, so that comparison would only repeat an assumption in the model.
Finding 03
Check what the plan pays your shop
Ask the provider two questions: what's the highest hourly labor rate the plan pays, and how many hours would it approve for the repair? Compare those answers with your shop's estimate. Your share of the bill could be more than the deductible.
Next, compare the full plan price plus the deductible with the part of a repair bill the plan would actually cover. Our calculator helps you do that for one claim. It doesn't predict whether you'll need the repair.
When local labor is expensive, check how much of the rate the contract will pay. High repair costs alone don't make every warranty a good deal. If the plan leaves you paying a large shortfall, compare another plan or keep a repair fund. With a fund, any money you don't spend stays yours.
Conclusion
Use the intended shop's rate to make the budget local
For a real repair, replace the modeled metro rate with the intended shop's written rate and confirm the hours for the diagnosed job. For a service-contract comparison, check how the agreement treats those same hours and that rate. The location experiment identifies a budget input that can materially change the total; it does not establish the payment a particular contract will make.
Explore the research and press resources →For reporting and citation
An interpretation you can quote
AutoWarranty's fixed eight-hour, 50-metro model shows that location assumptions can change a labor budget by $524.32 without changing the repair. A local rate check belongs in a vehicle repair budget.
AutoWarranty.Autos analysis
The numeric finding behind this interpretation
Holding a repair at eight labor hours, AutoWarranty's 50-metro model produces a $524.32 labor-only spread. The difference comes from location assumptions, not a different broken part.
AutoWarranty.Autos analysis
- Population
- 50 metros · fixed eight-hour scenario · no parts or tax
- Source snapshot
- Labor model reviewed 2026-09-04
- Analysis and presentation
- 2026-10-18; original publication 2026-09-04
The wording above is a suggested attributed quotation from our analysis. Link to this report and keep its population and assumptions with the finding.
Behind the numbers
How we worked it out
- Sort all included metros by modeled independent-shop midpoint, keeping ties in source order.
- Multiply each midpoint by eight. Exclude parts, diagnostics outside those hours, taxes, fees and model-specific calibration.
- Average the two central rates for the median. Round only final currency amounts, not intermediate arithmetic.
- Inputs are confidence-C modeling assumptions. This is reproducible scenario analysis, not new shop-price collection.
What these figures can't tell you
- The metro sample is not nationally representative.
- No failure rate, contract coverage or expected saving is inferred.
- Vehicle-specific repair estimates use additional calibration, deliberately excluded here.
The download has 50 data rows plus a header, generated from the same inputs as this page. Dates and units are listed in the columns or sources below. A blank field means the information wasn't available.
CSV column definitions
metrostateslugmodeled_independent_hourly_mid_usdfixed_labor_hoursmodeled_labor_only_usdevidence_type
Read each column with the units, population and limits stated in this study. A count describes the specified records; it does not establish a rate or probability.
Sources and corrections
- Labor inputs and confidence definitions · source or review date 2026-09-04
First published 2026-09-04. Visuals, analysis and conclusions reviewed 2026-10-18. Publication and presentation dates do not refresh the underlying snapshots. If you spot a problem, email me@autowarranty.autos with the page, data row and a source we can check.
Our calculations and explanatory charts may be cited with a link to this report. Underlying data retains its source terms. Download availability is not a grant of third-party content rights.