Main conclusion
A deductible alone may not describe the owner's contribution
Approval of the repair does not remove a difference between the shop's hourly rate and the agreement's permitted rate. In the fixed scenario, that difference produces $366.16 over eight approved hours. This is an isolated rate-gap calculation using chosen inputs, not a verified term or outcome of a particular plan.
Evidence scope: 50 modeled metro rates; eight approved labor hours; illustrative $150 hourly allowance. Source snapshot: Labor inputs reviewed 2026-09-04. The interpretation below uses these retained inputs.
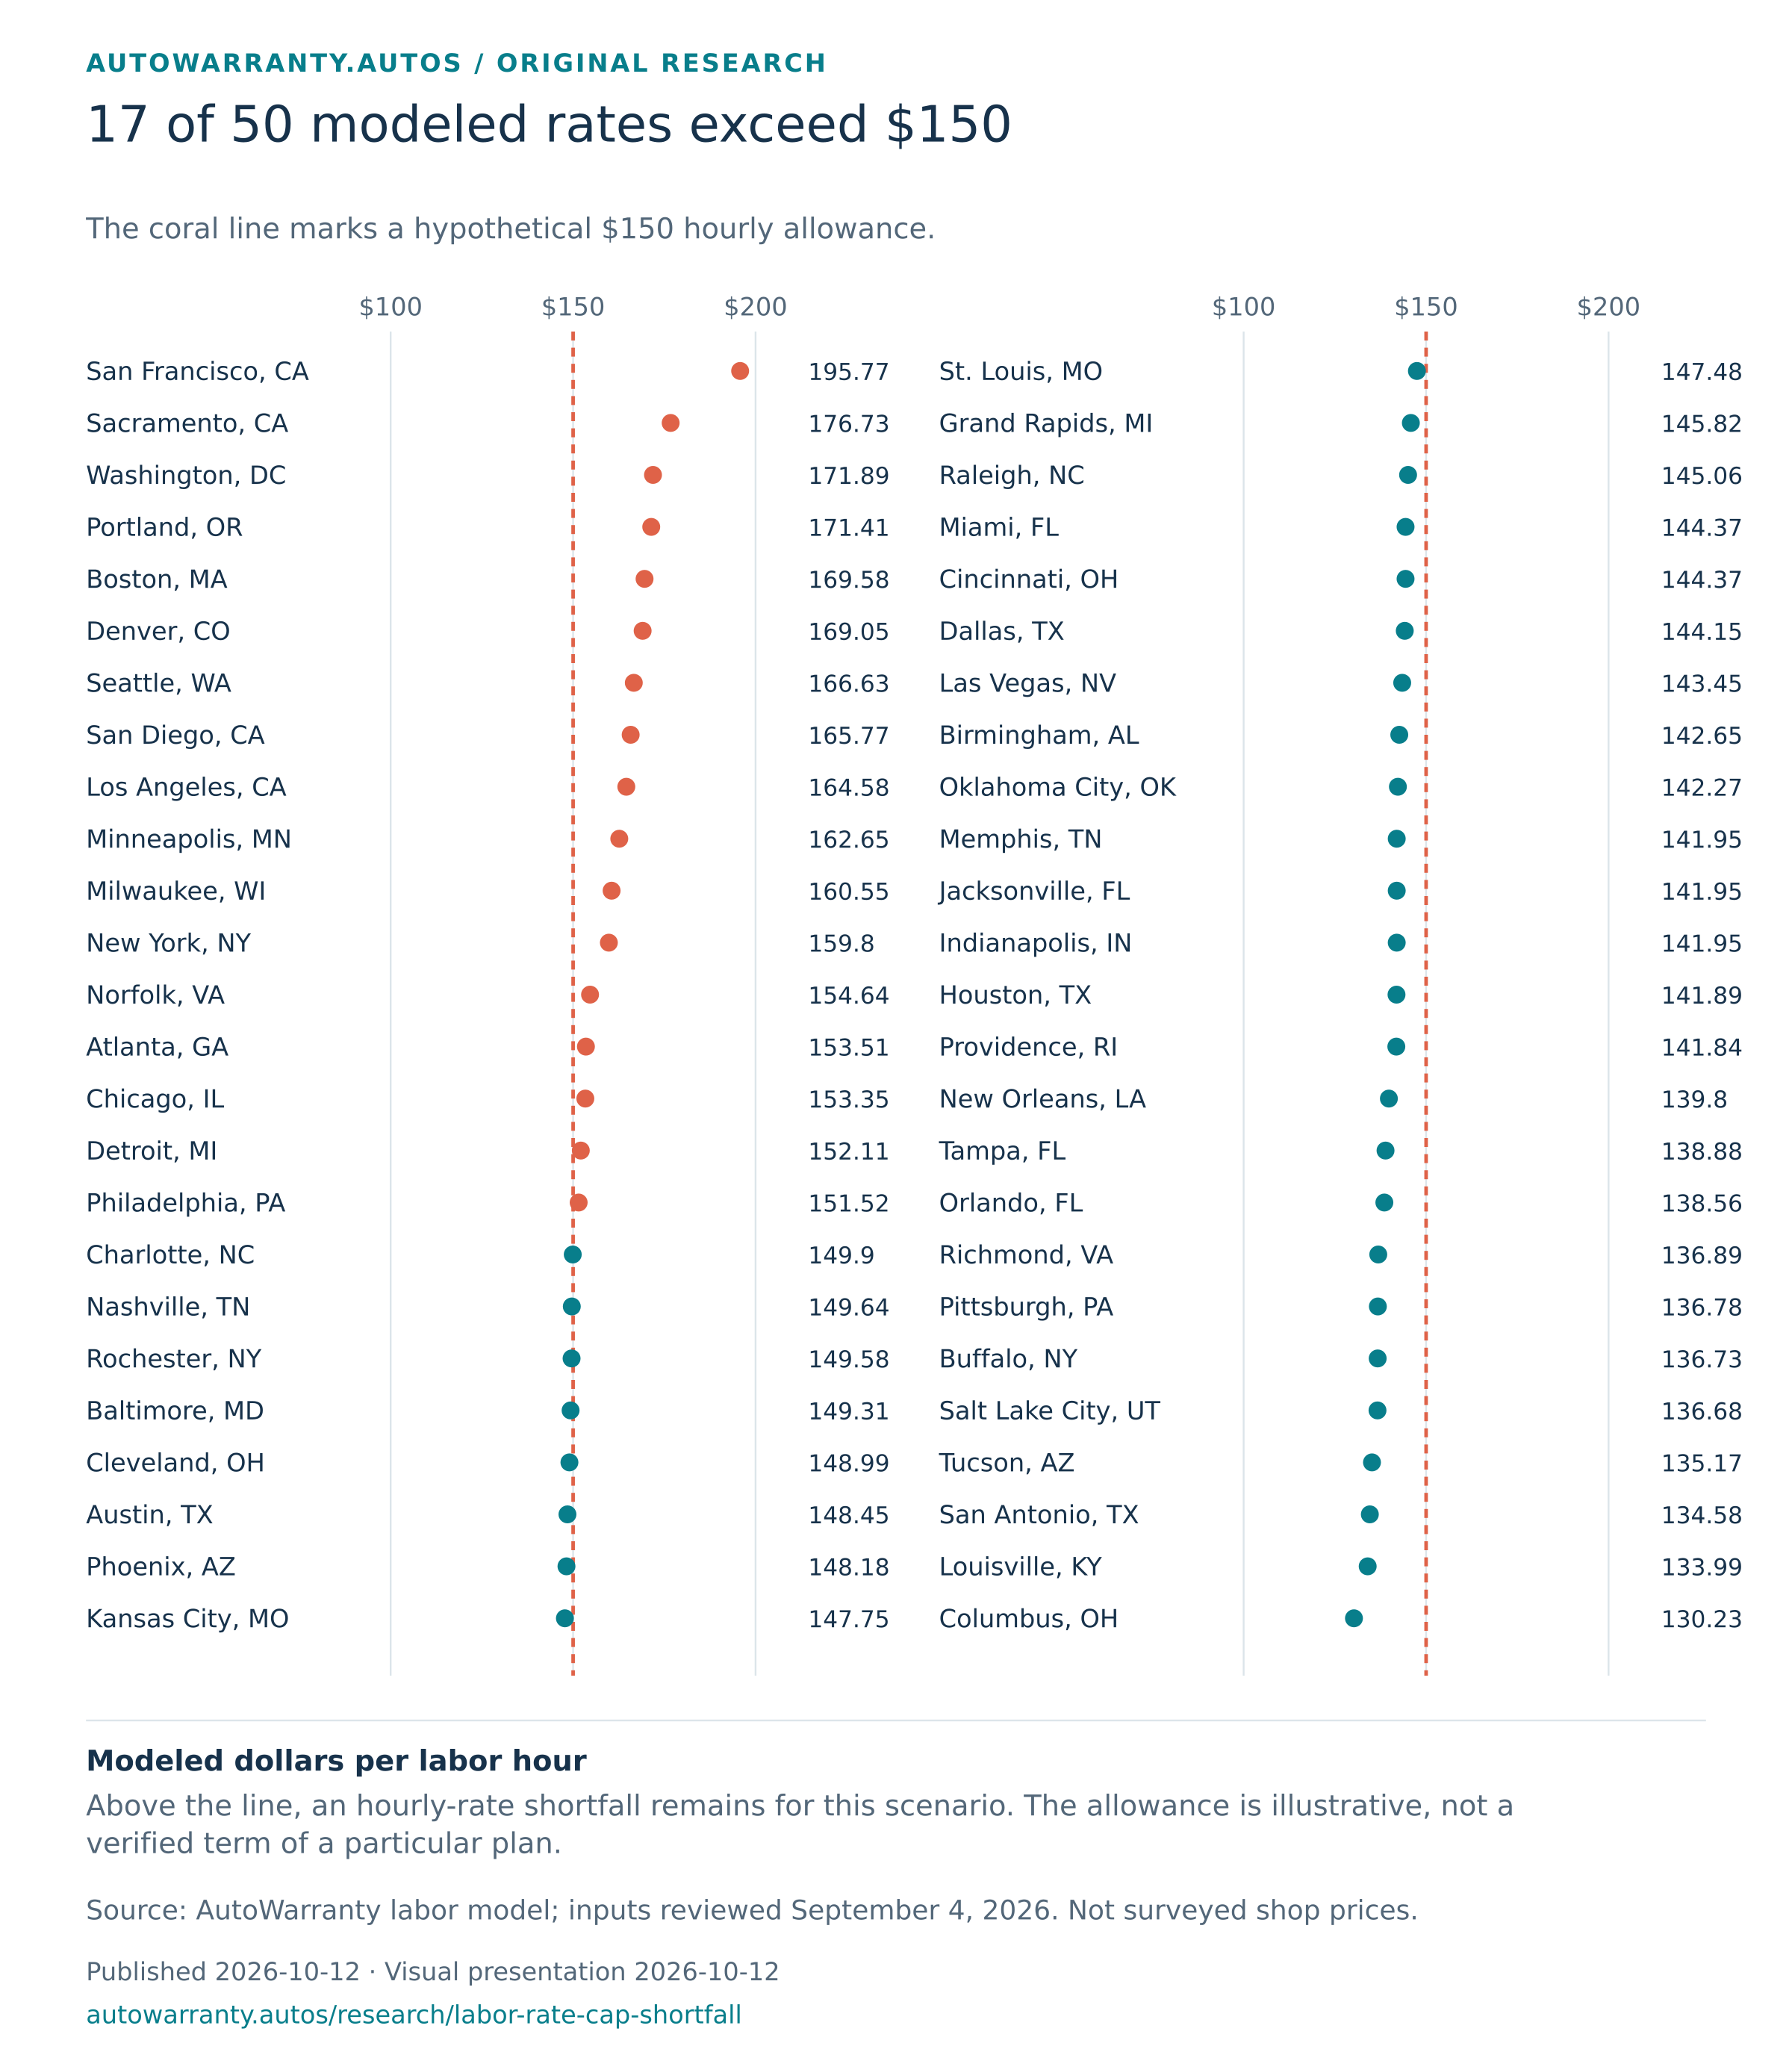
Above the line, an hourly-rate shortfall remains for this scenario. The allowance is illustrative, not a verified term of a particular plan.
AutoWarranty labor model; inputs reviewed September 4, 2026. Not surveyed shop prices.
Read the chart as a table
| Record or scenario | Modeled dollars per labor hour |
|---|---|
| San Francisco, CA | 195.77 |
| Sacramento, CA | 176.73 |
| Washington, DC | 171.89 |
| Portland, OR | 171.41 |
| Boston, MA | 169.58 |
| Denver, CO | 169.05 |
| Seattle, WA | 166.63 |
| San Diego, CA | 165.77 |
| Los Angeles, CA | 164.58 |
| Minneapolis, MN | 162.65 |
| Milwaukee, WI | 160.55 |
| New York, NY | 159.8 |
| Norfolk, VA | 154.64 |
| Atlanta, GA | 153.51 |
| Chicago, IL | 153.35 |
| Detroit, MI | 152.11 |
| Philadelphia, PA | 151.52 |
| Charlotte, NC | 149.9 |
| Nashville, TN | 149.64 |
| Rochester, NY | 149.58 |
| Baltimore, MD | 149.31 |
| Cleveland, OH | 148.99 |
| Austin, TX | 148.45 |
| Phoenix, AZ | 148.18 |
| Kansas City, MO | 147.75 |
| St. Louis, MO | 147.48 |
| Grand Rapids, MI | 145.82 |
| Raleigh, NC | 145.06 |
| Miami, FL | 144.37 |
| Cincinnati, OH | 144.37 |
| Dallas, TX | 144.15 |
| Las Vegas, NV | 143.45 |
| Birmingham, AL | 142.65 |
| Oklahoma City, OK | 142.27 |
| Memphis, TN | 141.95 |
| Jacksonville, FL | 141.95 |
| Indianapolis, IN | 141.95 |
| Houston, TX | 141.89 |
| Providence, RI | 141.84 |
| New Orleans, LA | 139.8 |
| Tampa, FL | 138.88 |
| Orlando, FL | 138.56 |
| Richmond, VA | 136.89 |
| Pittsburgh, PA | 136.78 |
| Buffalo, NY | 136.73 |
| Salt Lake City, UT | 136.68 |
| Tucson, AZ | 135.17 |
| San Antonio, TX | 134.58 |
| Louisville, KY | 133.99 |
| Columbus, OH | 130.23 |
Analysis
Why the rate rule changes the result after approval
At the highest modeled rate, the same eight hours produce a $1,566.16 labor bill and a $1,200 payment under the hypothetical allowance. The remaining $366.16 arises from the rate rule even though all eight hours are assumed approved. It is a different cost mechanism from a deductible or an excluded component.
Job length changes the consequence of the same rate mismatch. The $45.77 hourly gap produces $183.08 over four hours and $732.32 over sixteen. That proportional relationship explains why the hours and rate need to be read together. A higher hourly allowance cannot compensate for work that is not authorized in a real agreement.
The calculation also gives a useful rule for reading an estimate: each $10 of hourly-rate shortfall adds $80 over an eight-hour job. That is arithmetic with fixed approved hours, not an additional sampled repair. It shows why a modest-looking rate difference can become a noticeable bill item as the hours accumulate.
The 17-of-50 result is a sensitivity test within an equal-weight planning model. It is not a percentage of American shops or contracts. A zero hourly-rate gap also says nothing about parts, deductibles, taxes or other limits. The conclusion concerns one payment rule, not the whole claim.
Finding 01
Coverage of the part does not settle the hourly rate
At the highest hourly midpoint in our metro model, eight hours cost $1,566.16. An administrator allowing $150 for each of those same eight hours would pay $1,200 toward labor. The remaining $366.16 would sit outside that allowance before any deductible, parts exclusions, tax or other charge.
Seventeen of the 50 modeled metro midpoints exceed $150. That is a result within this equal-weight planning model. It is not a finding that 34% of American repair shops charge more than $150, or that 34% of contracts leave a shortfall.
The $150 allowance is an input we chose to show how a limit works. We have not established it as the allowance in a particular provider's agreement. A contract may use another rate rule, and the approved number of hours can differ from the shop's estimate.
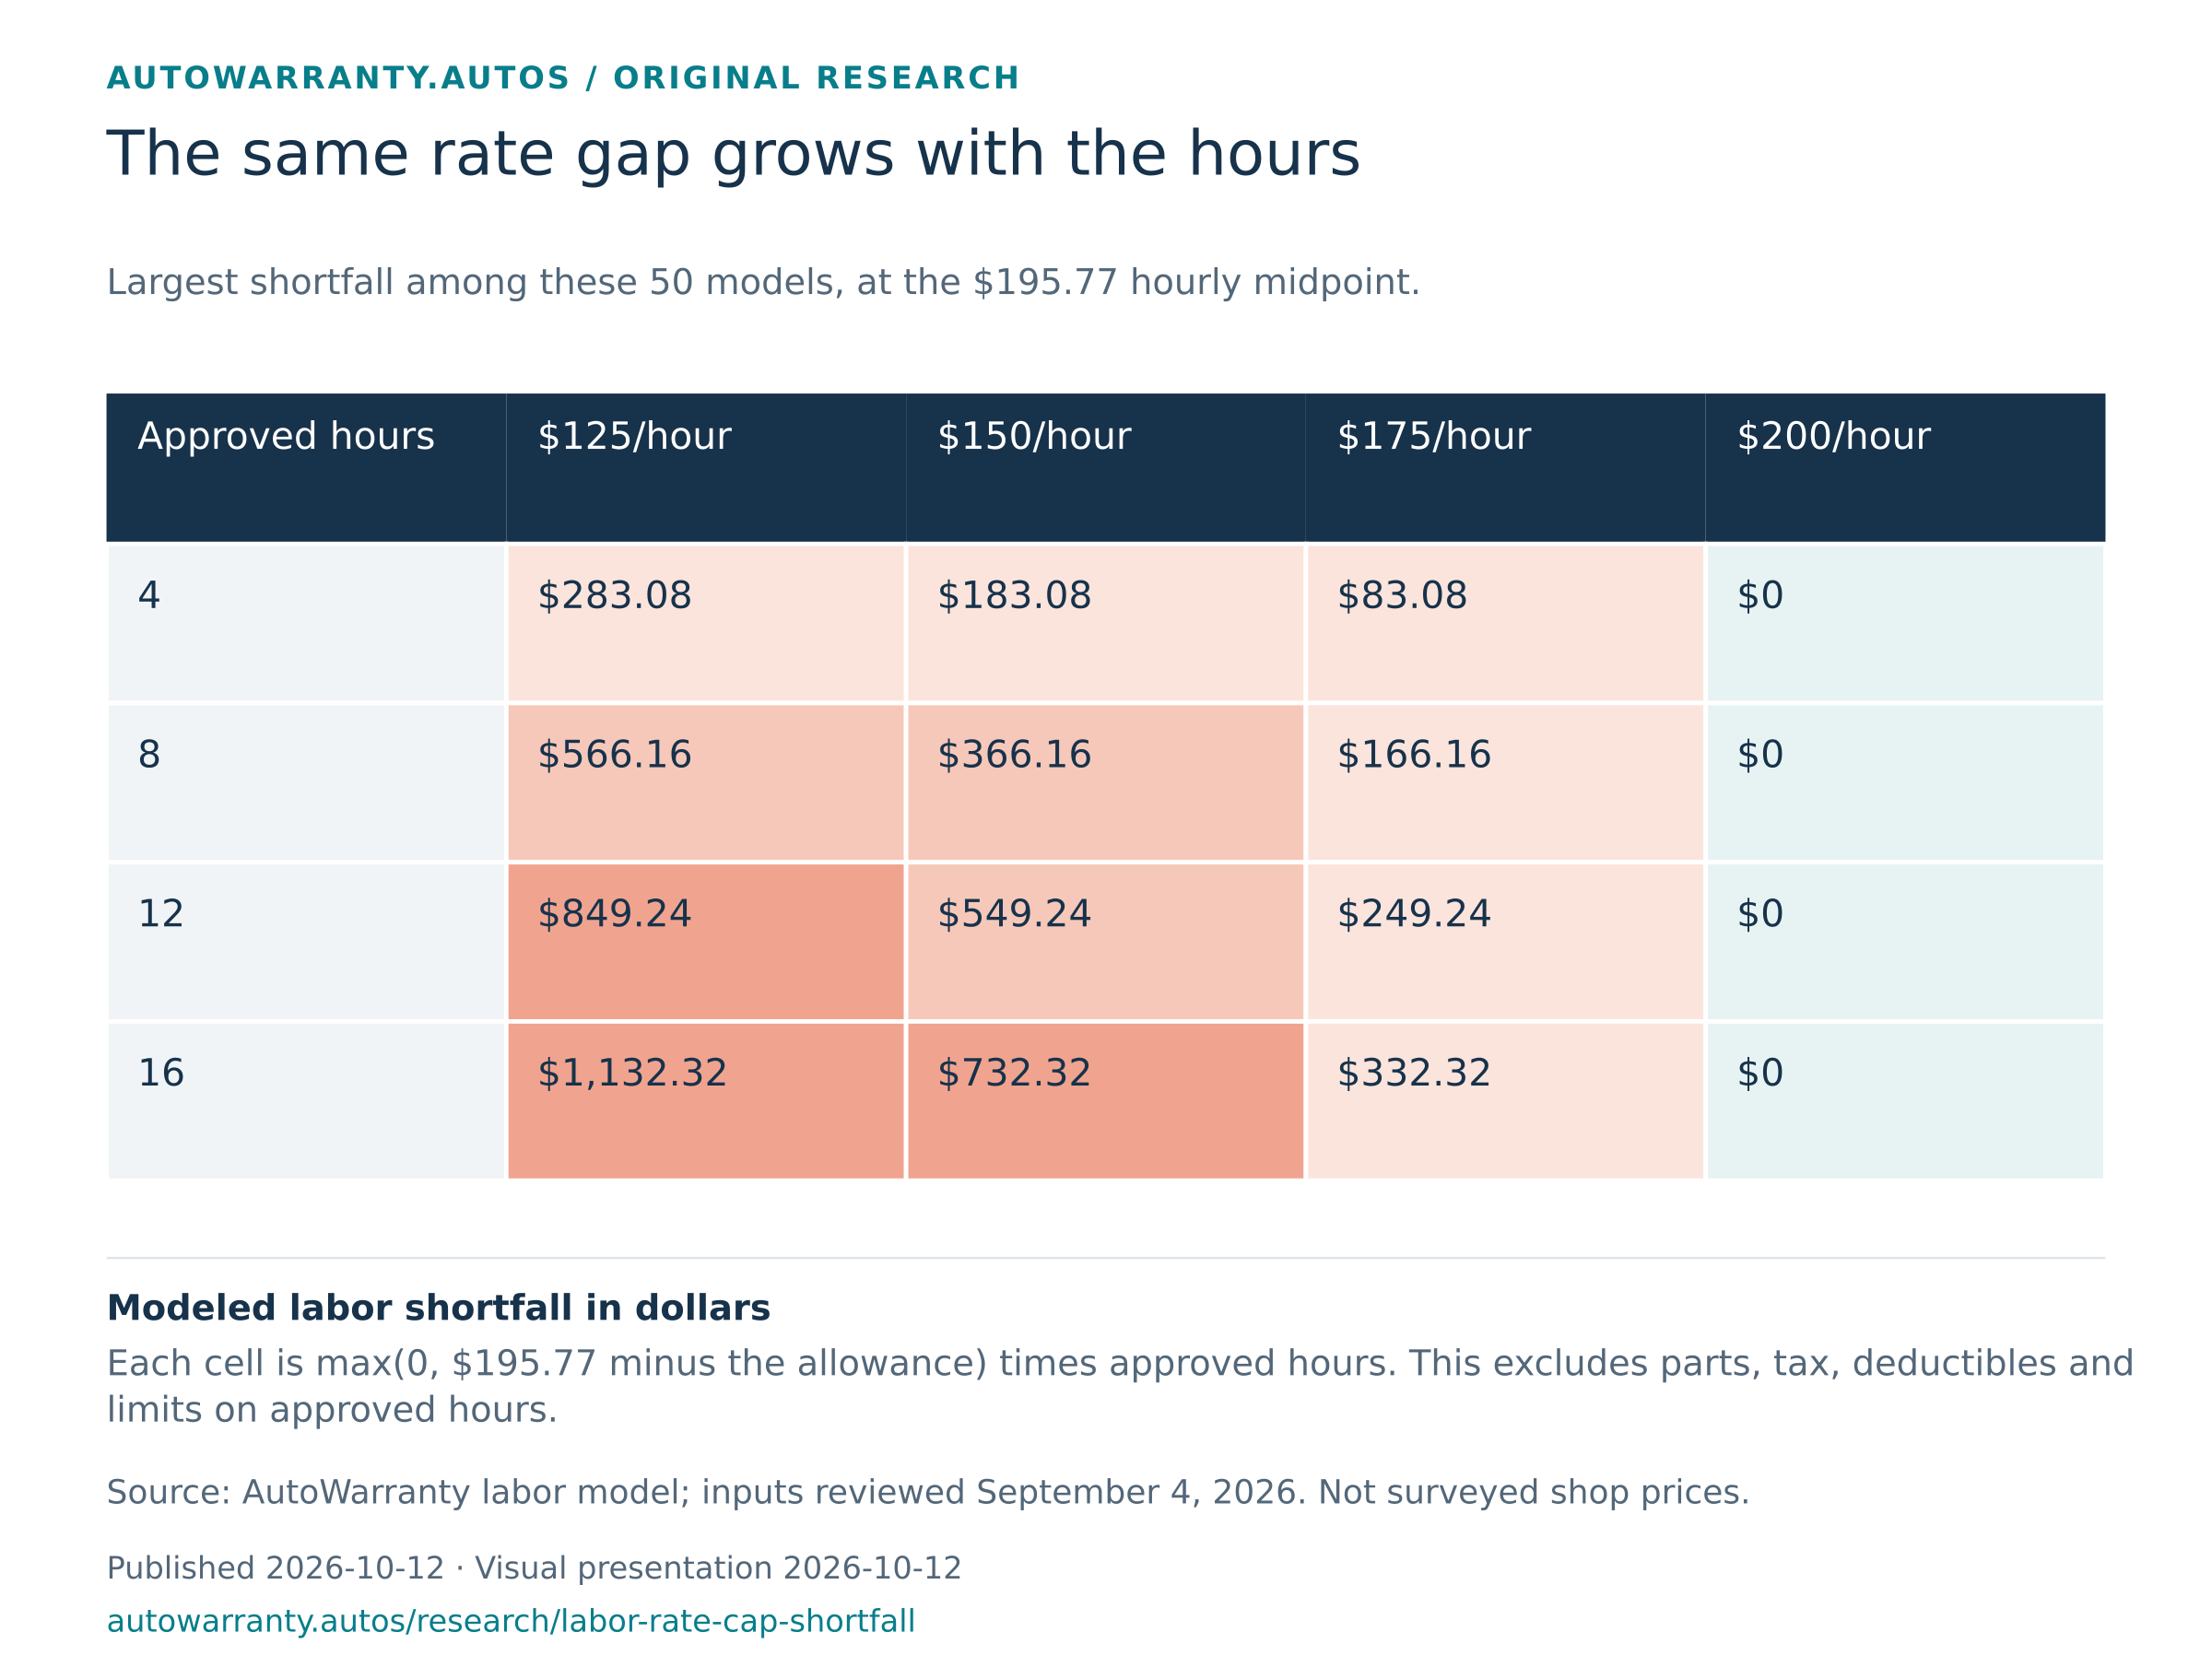
Each cell is max(0, $195.77 minus the allowance) times approved hours. This excludes parts, tax, deductibles and limits on approved hours.
AutoWarranty labor model; inputs reviewed September 4, 2026. Not surveyed shop prices.
Read the chart as a table
| Approved hours | $125/hour | $150/hour | $175/hour | $200/hour |
|---|---|---|---|---|
| 4 | $283.08 | $183.08 | $83.08 | $0 |
| 8 | $566.16 | $366.16 | $166.16 | $0 |
| 12 | $849.24 | $549.24 | $249.24 | $0 |
| 16 | $1,132.32 | $732.32 | $332.32 | $0 |
Finding 02
Job length makes the same rate gap larger
A $45.77 hourly difference produces $183.08 over four hours, $366.16 over eight hours and $732.32 over sixteen hours. Those are the same rate assumptions applied to different job lengths, not prices for three identified repairs.
The effect also works in the other direction. When the approved allowance meets or exceeds the modeled shop rate, this calculation gives a zero hourly-rate shortfall. A zero in that comparison does not remove the deductible or confirm that every other line of the bill is eligible.
For a real estimate, compare both dimensions: the hourly rate the agreement permits and the labor hours the administrator would authorize. A generous rate cannot offset hours the plan does not approve.
Finding 03
Use the estimate to ask for a dollar answer
Ask the shop for its hourly rate and the hours on the estimate. Ask the administrator which rate rule and labor guide would apply. Then calculate the potential difference before authorizing work.
This is a test of a contract term, not a ranking of providers. A quote with a lower premium can still be useful if its labor rules fit the shop you intend to use. The relevant comparison is the full price and the payment the agreement permits for an eligible repair.
Try a different assumption
Change the allowance and approved hours
Use the same 50 modeled hourly rates. These are planning scenarios, not local shop quotes.
Shortfall = max(0, modeled hourly rate − allowance) × approved hours. Other bill items and limits are excluded.
Conclusion
Compare the permitted labor payment with the written estimate
Ask for the shop's rate and hours, then check the agreement's rate rule and authorization basis for that job. Calculate any hourly-rate difference separately from the deductible and other bill items. The experiment establishes how a chosen rate limit can leave a gap after assumed approval; an actual contract and estimate are needed to determine whether that mechanism applies.
Explore the research and press resources →For reporting and citation
An interpretation you can quote
An approved repair and a fully reimbursed labor bill are different questions. AutoWarranty's hypothetical $150 allowance leaves an eight-hour rate gap of up to $366.16 in its 50-metro model, before any deductible.
AutoWarranty.Autos analysis
The numeric finding behind this interpretation
A hypothetical $150 hourly allowance leaves a gap in 17 of AutoWarranty's 50 modeled metro scenarios. For eight approved hours, the largest modeled shortfall is $366.16 before a deductible.
AutoWarranty.Autos analysis
- Population
- 50 modeled metro rates; eight approved labor hours; illustrative $150 hourly allowance
- Source snapshot
- Labor inputs reviewed 2026-09-04
- Analysis and presentation
- 2026-10-12; original publication 2026-10-12
The wording above is a suggested attributed quotation from our analysis. Link to this report and keep its population and assumptions with the finding.
Behind the numbers
How we worked it out
- Use all 50 independent-shop hourly midpoints in the retained labor model, one equal-weight row per metro.
- Hold the job at eight approved hours and the illustrative hourly allowance at $150.
- Calculate hourly shortfall as max(0, modeled rate minus allowance), multiplied by eight; round the final dollar amount to cents.
- Do not apply a population weight, observed shop survey, failure frequency, deductible, parts price or provider-specific contract rule.
What these figures can't tell you
- The labor rates are confidence-C planning assumptions, not collected shop invoices.
- The allowance and approved hours are illustrative inputs, not verified terms of a specific product.
- The result isolates hourly-rate differences and is not total out-of-pocket cost or expected ownership cost.
The download has 50 data rows plus a header, generated from the same inputs as this page. Dates and units are listed in the columns or sources below. A blank field means the information wasn't available.
CSV column definitions
metrostatemodeled_hourly_rate_usdassumed_allowance_usd_per_hourassumed_approved_hoursmodeled_labor_bill_usdmodeled_hourly_rate_shortfall_usdevidence_type
Each row is a modeled metro, not a surveyed repair shop. The hourly allowance and eight approved hours are fixed assumptions. Shortfall excludes the deductible, parts and tax.
Sources and corrections
- Cost inputs, source dates and confidence definitions · source or review date 2026-09-04
- FTC service-contract guidance · source or review date 2026-10-12
First published 2026-10-12. Visuals, analysis and conclusions reviewed 2026-10-12. Publication and presentation dates do not refresh the underlying snapshots. If you spot a problem, email me@autowarranty.autos with the page, data row and a source we can check.
Our calculations and explanatory charts may be cited with a link to this report. Underlying data retains its source terms. Download availability is not a grant of third-party content rights.